The Ministry of Land, Infrastructure, Transport and Tourism has recently disclosed Flow of Foreigners Data (FF-Data) from 2015 and 2016. The analytic data, combining Japan Tourism Agency's trend survey on foreign visitors' spending and the Civil Aviation Bureau's trend survey on international passengers, details nationalities, selected modes of transportation, touring routes, guest nights, departure airports, travel styles, etc.
See 3 examples hereafter...
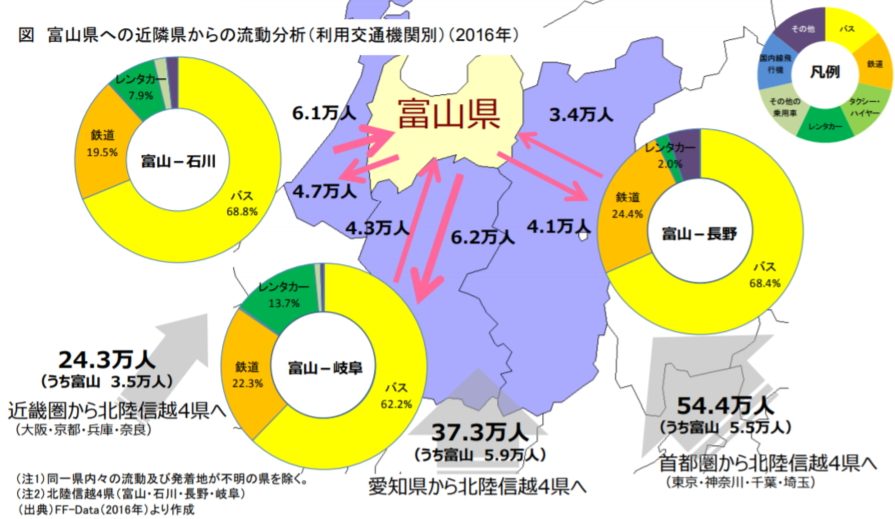
1. Movements to a particular prefecture (case of Toyama) from neighboring prefectures:
The illustration below shows that a direct flow of travelers exists from Aichi Prefecture to Toyama Prefecture but is relatively small. It also shows that the main transportation mode between Toyama and its neighboring prefectures is the bus (yellow portions).
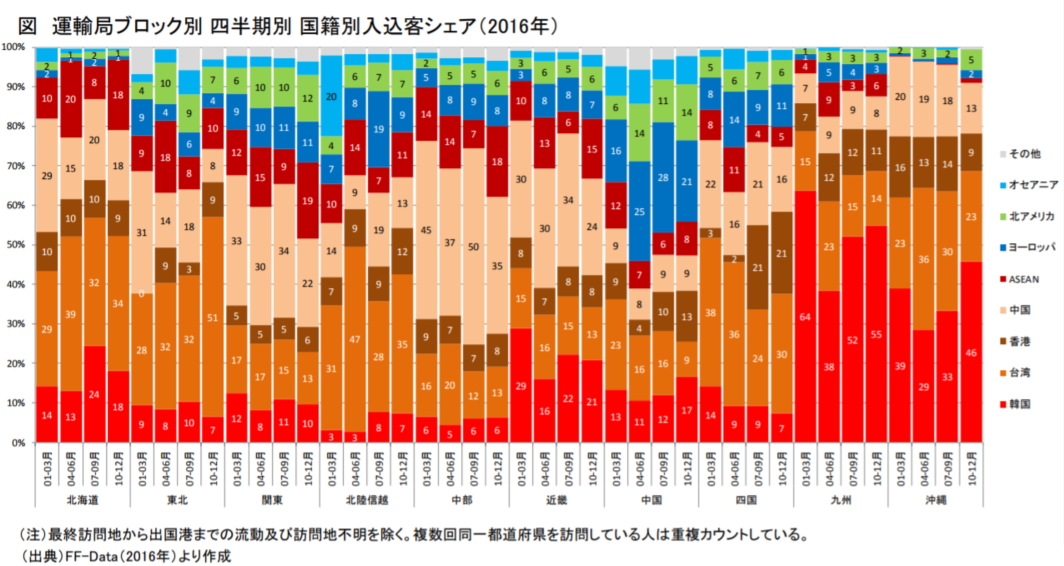
2. Percentages of visitors by nationality in each region:
The illustration below reveals a high share of Korean travelers (bottom red) in Kyushu (second block from the right) and a high share of Chinese travelers (beige at the center) in Kanto, Chubu and Kinki. It also shows that the share of travelers from Europe (dark blue) or North America (green) is relatively high in Chugoku (fourth block from the right).
3. Analyses by nationality and travel style:
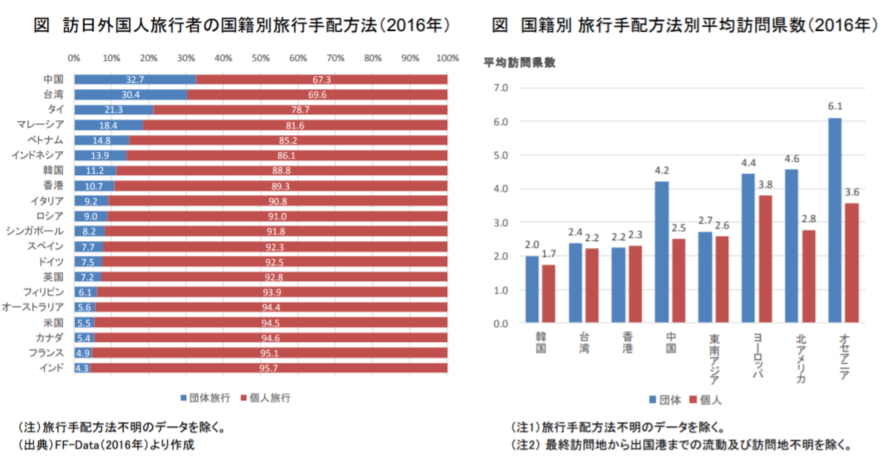
The graphics below show that 30-40% of the Chinese and Taiwanese travel in group. They also show that travelers from China, Europe, North America and Australia travelling in groups visit more prefectures on average.
